


Role of elastic scattering in high-order above threshold ionization
[Chen Zhang-Jin† , Ye Jian-Mian, Xu Yang-Bing]
, Ye Jian-Mian, Xu Yang-Bing]
|
|


†Corresponding author. E-mail: chenzj@stu.edu.cn
*Project supported by the National Natural Science Foundation of China (Grant No. 11274219), the STU Scientific Research Foundation for Talents, and the Scientific Research Foundation for the Returned Overseas Chinese Scholars, State Education Ministry, China.
We investigate the target and intensity dependence of plateau in high-order above threshold ionization (HATI) by simulating the two-dimensional (2D) momentum distributions and the energy spectra of photoelectrons in HATI of rare gas atoms through using the quantitative rescattering model. The simulated results are compared with the existing experimental measurements. It is found that the slope of the plateau in the HATI photoelectron energy spectrum highly depends on the structure of elastic scattering differential cross section (DCS) of laser-induced returning electron with its parent ion. The investigations of the long- and short-range potential effects in the DCSs reveal that the short-range potential, which reflects the structure of the target, plays an essential role in generating the HATI photoelectron spectra.
High-order above threshold ionizations (HATIs) of atoms and molecules in intense laser pulses have been extensively studied for more than two decades. The photoelectron energy spectra of HATI are characterized by a plateau following the low energy spectra which decreases exponentially as the energy increases. The plateau starts from (3– 4)Up, where Up is the ponderomotive energy, and ends at a cutoff energy of 10Up. The essential physics behind the production of a plateau has been revealed by the rescattering model[1, 2] in which the HATI plateau has been explained as being due to electrons returning to the parent ion during the ionization process and rescattering elastically with it. It has been well established that the differential cross section (DCS) of elastic scattering between free electron and atomic ion can be extracted from the HATI photoelectron momentum spectra.[3– 7] Furthermore, Xu et al.[8] demonstrated that with the implementation of a genetic algorithm, atomic potentials can be retrieved from the DCSs. Recently, with the development of attosecond science, the HATI process has attracted more attention since the laser-induced electron diffraction can be used to image atomic and molecular structures with subangstrom precision and exposure time of a few femtoseconds.[9– 11]
Despite the fact that all the photoelectron energy spectra of HATI exhibit a plateau structure, the flatness of the plateau depends on the targets and laser parameters. A lot of theoretical efforts have been devoted to the simulations of the HATI spectra. Generally, two kinds of numerical methods are used. The first one is to solve the time-dependent Schrö dinger equation (TDSE) within the single-active electron approximation. However, the TDSE calculations are very time-consuming and very computationally demanding for long pulses at high intensities. This makes the implementation of TDSE extremely restricted. As a consequence, the TDSE calculations are not adequate for the simulations of real experiments. In addition, even if the numerical solutions of the TDSE can be carried out, the insight into physics is hidden although the results provide an accurate and general view of the HATI processes, and the explanation for the origin of specie and laser parameter dependence of the flatness of the plateau is not clear. The other theoretical model is based on the strong field approximation (SFA) which was originally proposed for the direct ionized electrons[12– 14] and later on, was generalized to account for the rescattering of the returning electrons with the parent ion by including the interaction with the binding potential within the first Born approximation.[15] The SFA model is of great interest for analyzing the features of intense laser– atom interactions since the information about the direct and rescattering electrons can be obtained separately. Unfortunately, the first Born approximation is only exact for a pure Coulomb potential. This implies that except for hydrogen atoms (or hydrogenic ions), the calculated results of SFA cannot be used to compare with experimental measurements directly.
The limitation of the SFA model on accurate simulations of HATI spectra was removed by Chen et al. who proposed a quantitative rescattering (QRS) model.[3, 6] While still maintaining the philosophy of SFA, the QRS model treats the two-dimensional (2D) momentum distributions of photoelectrons as the product of a returning electron wave packet with the elastic DCS for free electrons scattering with the target ion. In the QRS model the elastic DCSs are calculated by using the standard potential scattering theory in which the scattering wave functions are evaluated numerically by solving the Schrö dinger equation where the optimized single-active electron potential including short-range contributions is used. This treatment makes the QRS model far beyond the SFA model.
In this paper, we employ the QRS model to simulate the HATI photoelectron spectra for rare gas atoms and investigate the origin of the target dependence of plateau flatness. The long-range and short-range potential effects are also discussed. Atomic units (a.u.) me = ħ = e = 1 are used throughout the paper unless otherwise indicated.
The basic theory of the QRS model has been presented in detail in Refs. [6] and [16]. Here we only give a brief review.
According to the QRS model, when an atom is singly ionized by an intense linearly polarized laser field with intensity I, the yield of photoelectron with momentum p can be represented as

where σ (kr, θ r) is the DCS for a free electron with momentum kr elastically scattered, with the parent ion, at an angle θ r with respect to the direction of the returning electron beam whose flux is described by the wave packet 


Furthermore, to obtian the one-to-one relation between p and 

 | Fig. 1. Illustration of the elastic rescattering processes in the momentum space for the case in which the returning electron revisits the parent ion along  |
Equation (3) is established based on the classical simulations.[6]
The factorization property presented in Eq. (1) reflects the inherent merit of the QRS model which allows one to extract the DCSs directly from the measured 2D momentum distributions since the wave packet depends only on the laser field. The QRS model has been widely used to simulate the HATI spectra[6, 16, 18– 20] as well as the correlated momentum spectra for nonsequential double ionization in strong laser fields[21, 22] and also has been successfully used to extract the DCSs for elastic electron scattering off positive ions of rare gases from the experimental HATI data.[5, 9, 23] However, it should be noted that equation (1) was originally proposed as a plausible conjecture with no theoretical derivation.
The derivation of the factorization formula was accomplished later by Č erkić et al.[7]
The details for the calculations of the wave packet 
We use standard potential scattering theory to calculate the elastic scattering DCSs, and the details can also be found in Ref. [6]. As is well known, the effective single electron potential plays a crucial role in calculating the DCSs. For elastic scattering of free electrons with target ions He+ , Ne+ , Ar+ , and Xe+ , the potential used in this paper takes the following form[24]

where Zc is the charge seen by the active electron asymptotically and the parameter ai’ s are obtained by fitting the calculated binding energies from this potential to the experimental ones of the ground state and the first few excited states.[24] The parameters for He, Ne, Ar, and Xe are given in Table 1.
| Table 1. Atomic parameters used in the model potential. |
For Kr, the parameters in Eq. (4) are not available. Instead, we use the potential presented by Garvey et al., [25]

where Z is the nuclear charge and c(r) is the screening function

The parameters η and ξ in Eq. (6) are determined by using the ab initio energy-minimization procedure. For Kr, η = 4.29 and ξ = 1.351.
The simulated results by employing the procedures described in the above subsection may not be used to compare with the experimental data directly without taking into account the focus volume effect. This is due to the fact that the intensity distribution of a focused laser beam is not uniform in space. Since the HATI electrons collected in experiment originate from atoms located everywhere in the interaction volume and consequently experience different peak intensities, the integration over the focus volume should be performed by finding the volume of each isointensity shell

where I0 is the peak intensity of the laser field. For a laser beam with Lorentzian distribution in the propagation direction (z) and Gaussian distribution in the transverse direction (ρ )

with

where 2ω 0 is the 1/e-folding diameter of the focal spot, and 
where c1 = [(I0 − I)/I]1/2 and c2 = {[I0 − (I + dI)]/(I + dI)}1/2. Since the DCS σ (kr, θ r) in Eq. (1) does not depend on laser parameters, equation (7) can be rewritten as

where

In this section, we analyze the relationship between the target and the intensity of the HATI plateau by comparing the simulated results for rare gas atoms using the QRS model with the experimental measurements.
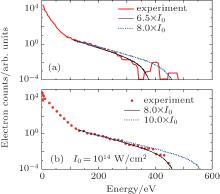
Among all the rare gas atoms, helium has the largest binding energy. Usually, laser pulses at higher intensities are used for helium in experiment than for other rare gas atoms. Sheehy et al.[27] performed high precision measurements of HATI photoelectron distributions for single ionization of helium by 120-fs laser pulses with a wavelength of 780 nm at intensities of 0.8 pW/cm2 and 1.0 pW/cm2. These data provide a direct quantitative test of various theories of strong-field ionization. In Fig. 2 the simulated results obtained by using the QRS model, with the focal volume effect taken into account, are compared with the experimental measurements. Figures 2(a) and 2(b) show the simulated results at two different peak intensities, one corresponds to the peak intensity estimated by the experimentalists, which obviously overestimates the yield of photoelectrons at high energies, and the other one corresponds to an intensity about 20% lower than the estimated one but gives the best overall agreement with experimental results. This indicates that the real peak intensities of the laser pulses used in experiment are about 20% lower than the estimated ones. This is not surprising since in experiment the calibration for peak intensity was corroborated by a spot size measurement and is accurate to approximately 25%.[27] It should be noted that the measured spectra at energies above 350 eV in Fig. 2(a) can be ignored since they exhibit an unexpected greatly increased yield followed by a fast drop and another abrupt jump. This phenomenon conflicts with the general behavior of the HATI spectra.
 | Fig. 2. Comparison of angle-integrated photoelectron energy spectra of the QRS model including the focal volume averaging and the experimental measurements of Sheehy et al.[27] for single ionization of He in a 120-fs pulse with a wavelength of 780 nm at peak intensities of (a) 8.0× 10¹⁴ W/cm2 and (b) 10.0× 10¹⁴ W/cm2. The QRS results are shown for energies above 3Up– 4Up. The QRS spectra are relative and normalized to the experimental data at high energies. See text. |
Based on the comparison between the theoretical simulations and the experimental measurements, from now on, it is reasonable to take the peak intensities for laser pulses used in the experiment to be 6.5× 10¹⁴ W/cm2 and 8.0× 10¹⁴ W/cm2 in Figs. 2(a) and 2(b), respectively.
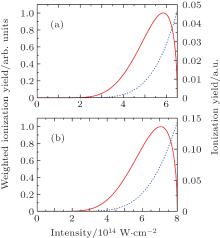
To show the effects of focal averaging in the numerical simulations, in Fig. 3 we plot the intensity dependences of the original ionization yield and the weighted ionization yield for single ionization of He in a 120-fs pulse with a wavelength of 780 nm at peak intensities of 6.5× 10¹⁴ W/cm2 and 8.0× 10¹⁴ W/cm2, respectively. The original ionization yield for each single intensity is obtained from the modified ADK model.[24] The weighted ionization yield, which is a product of the original ionization yield and the focal volume element, represents the real differential intensity contributions for the final focal volume-averaged photoelectron spectra. It can be seen from Figs. 3(a) and 3(b) that both the contributions from the low intensity region below 2.5× 10¹⁴ W/cm2 and the high intensity region close to the peak intensity are very small. In the intensity distribution of weighted ionization yield, the peak position corresponds to the dominant intensity which makes the largest differential intensity contributions. The dominant intensities for the peak intensities of 6.5× 10¹⁴ W/cm2 in Fig. 3(a) and 8.0× 10¹⁴ W/cm2 in Fig. 3(b) are 5.9× 10¹⁴ W/cm2 and 7.0× 10¹⁴ W/cm2, respectively.
 | Fig. 3. Intensity dependences of the weighted ionization yield (solid curve, left vertical axis) and the ionization yield (dotted curve, right vertical axis) for single ionization of He in a 120-fs pulse with a wavelength of 780 nm at peak intensities of (a) 6.5× 10¹⁴ W/cm2 and (b) 8.0× 10¹⁴ W/cm2. See text. |
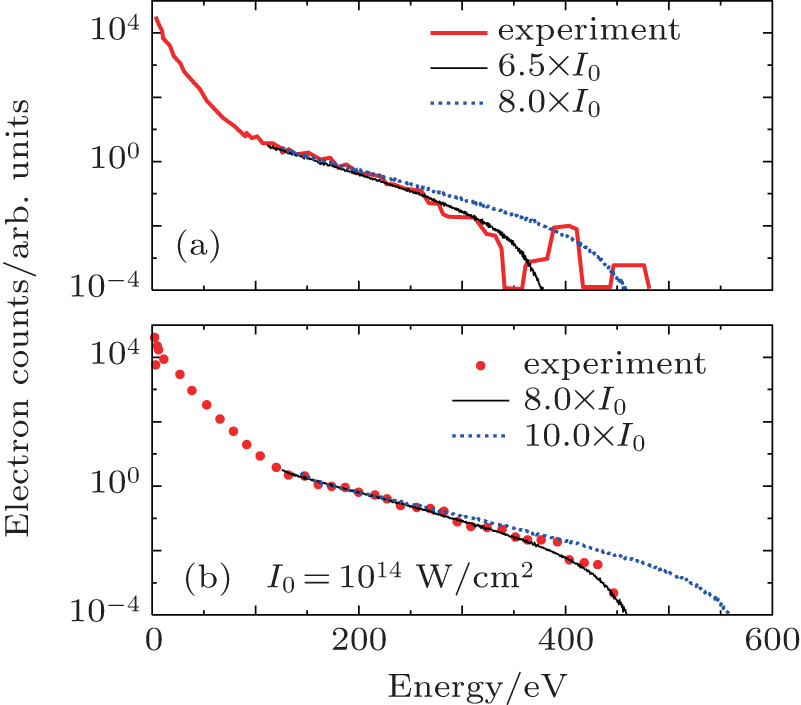
The intensity dependences of the weighted ionization yield shown in Fig. 3 clearly indicate that simulated results without performing the focal volume averaging can never reach good agreement with the experimental measurements. This is confirmed by the comparison of the QRS results without taking into account the focal volume effects at peak and dominant intensities with the experiment, which is shown in Fig. 4. One can see that the simulated results at both peak and dominant single intensities produce a flatter plateau and those at peak intensities predict higher-energy electrons than experimental results. Nevertheless, despite the discrepancies, the dominant intensity is a better choice than the peak intensity if a single intensity is preferred.
 | Fig. 4. Comparison of angle-integrated photoelectron energy spectra of the QRS model for single intensity only without including the focal volume averaging and the experimental measurements of Sheehy et al.[27] for single ionization of He in a 120-fs pulse with a wavelength of 780 nm at peak intensities of (a) 8.0× 10¹⁴ W/cm2 and (b) 10.0× 10¹⁴ W/cm2. The QRS results are shown for energies above (3– 4)Up. The QRS spectra are relative and normalized to the experimental data at high energies. See text. |
Sheehy et al.[27] also performed semiclassical calculations based on the rescattering model which includes a description of a field-driven electron elastically scattered from an accurate ion core potential and a pure Coulomb potential as well for the peak intensity of 8.0× 10¹⁴ W/cm2, while for 10.0× 10¹⁴ W/cm2 only the results incorporating rescattering from the full He+ potential were presented. In Fig. 5, the calculated results of Sheehy et al.[27] are plotted to compare with the corresponding QRS simulations along with the experimental measurements. The same as the QRS results, the calculations of Sheehy et al. also include focal volume averaging. However, it should be noted that the peak intensities used in the present simulations are different from those of Sheehy et al. We use 6.5× 10¹⁴ W/cm2 and 8.0× 10¹⁴ W/cm2 as the peak intensities in Figs. 5(a) and 5(b) respectively due to the reason discussed before. Again, by comparing the semiclassical results from the full potential of He+ (broken curves), one can see clearly that Sheehy et al. overestimated the peak intensities used in the experiment. Furthermore, the slope of the HATI plateau observed in the experiment is quite different from that predicted by the semiclassical model.
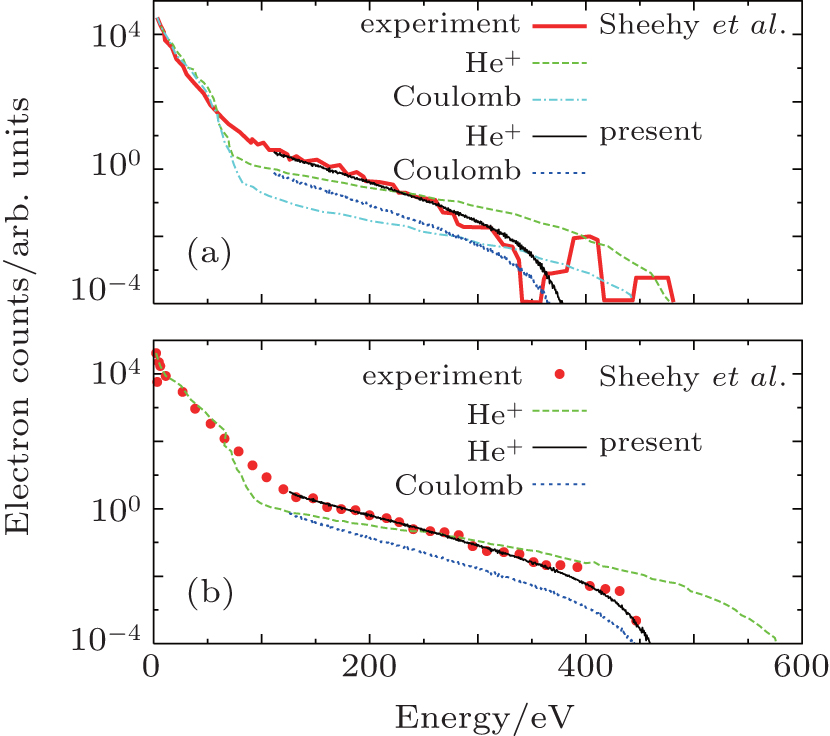 | Fig. 5. Comparison of angle-integrated photoelectron energy spectra of the QRS model, calculated with the full potential of He+ and the pure Coulomb potential only including the focal volume averaging, and the experimental measurements and the semiclassical simulations of Sheehy et al.[27] for single ionization of He in a 120-fs pulse with a wavelength of 780 nm at peak intensities of (a) 8.0× 10¹⁴ W/cm2 and (b) 10.0× 10¹⁴ W/cm2. The QRS results are shown for energies above 3Up– 4Up. The QRS spectra calculated with the full potential of He+ and the pure Coulomb potential only are relative and normalized to the experimental data at high energies with the same factor. See text. |
It has been well established that both the height and the shape (slope) of the simulated HATI plateau depend on the ion core potential used in the calculations. The theoretical results of Sheehy et al. using the pure Coulomb potential only, shown in Fig. 5(a) (chain curve), are about one order of magnitude smaller than those with using the full potential while the slope remains almost the same. The difference between the present QRS simulations with the full potential (black solid curves) and the pure Coulomb potential (dotted curves) is similar in both Figs. 5(a) and 5(b). This difference actually results from the DCSs for electron elastic scattering with the two potentials.
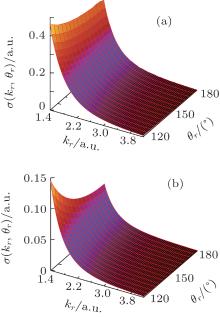
Figure 6 shows the 2D DCSs as a function of the scattering angle and the momentum magnitude of electrons elastically scattered with the full potential of He+ and the pure Coulomb potential, respectively. The ranges of the scattering angle and the momentum magnitude plotted in Fig. 6 are chosen according to the DCSs which contribute to the HATI spectra in the region from 3Up to 12Up for the cases considered here. The full potential of the ion core consists of the long-range pure Coulomb potential − Zc/r and the short-range potential which carries the structure information of the target atoms. Unfortunately, for He, both the angular and the momentum distributions of the DCSs of the full potential in Fig. 6(a) are monotonic and structureless, which are similar to those of the pure Coulomb potential in Fig. 6(b). This explains why the slopes of the simulated plateau with the two potentials are almost the same. On the other hand, the smaller DCSs of the pure Coulomb potential, compared with those of the full potential, explain why the corresponding simulated HATI plateau is lower than that with the full potential.
 | Fig. 6. 2D DCSs for elastic scattering of electrons with (a) the full potential of He+ and (b) the pure Coulomb potential. |
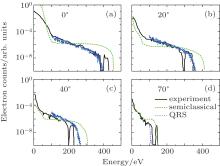
In Fig. 7, we show the comparison of the angle-resolved photoelectron energy spectra of the QRS model and the semiclassical simulations as well as the experimental measurements of Sheehy et al.[27] for single ionization of He in a 120-fs pulse with a wavelength of 780 nm at the peak intensity of 8.0× 10¹⁴ W/cm2 and angles of 0° , 20° , 40° , and 70° . The peak intensity taken in the QRS simulations is 6.5× 10¹⁴ W/cm2. Again, in both the present QRS and the semiclassical simulations of Sheehy et al.[27] the focal volume averaging is included. For the QRS results, only the photoelectron spectra at energies above 100 eV are shown. The QRS spectra are renormalized to the experimental data with a fixed factor for all outgoing angles. In general, the experimental measurements are well reproduced by the QRS simulations while the semiclassical model predicts a flatter HATI plateau again. However, it should be noted that the QRS overestimates the photoelectron yield for 40° , which might imply that the outgoing angle of the photoelectron is actually smaller. In addition, for 70° , the maximum photoelectron energy is less than 4Up, which means that the comparison between the QRS and experiment is meaningless.
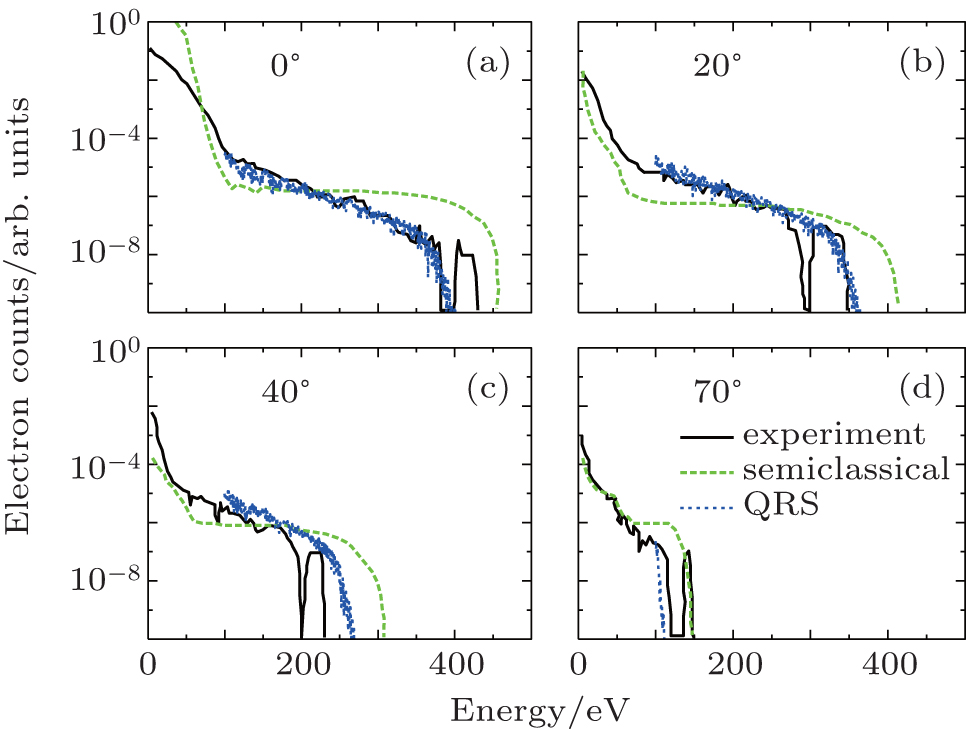 | Fig. 7. Comparison of the angle-resolved photoelectron energy spectra of the QRS model and the semiclassical simulations as well as the experimental measurements of Sheehy et al.[27] for single ionization of He in a 120-fs pulse with a wavelength of 780 nm at the peak intensity of 8.0× 10¹⁴ W/cm2 at angles of (a) 0° , (b) 20° , (c) 40° , and (d) 70° . See text. |
The experiments performed by Paulus et al.[28] are exclusively suitable for the purpose of this paper to investigate the target and intensity dependence of the plateau in HATI. In Ref. [28], the photoelectron energy spectra for the rare gas atoms He, Ne, Ar, Kr, and Xe in strong laser pulses were measured. While focusing on demonstrating that the plateau is a general property in the HATI photoelectron distributions, Paulus et al. did not discussed much about the target and intensity dependence of the plateau.
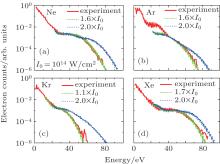
The target dependence of the plateau is illustrated in Fig. 8 which shows the experimental measurements of Paulus et al.[28] for single ionizations of Ne, Ar, Kr, and Xe in a 40-fs pulse with a wavelength of 630 nm at a peak intensity of 2.0× 10¹⁴ W/cm2. The corresponding angle-integrated photoelectron energy spectra of the QRS model are also plotted for comparison in Fig. 8. Interestingly, all the simulated results with using the same peak intensity as that claimed in Ref. [28] produce higher electron yields in HATI spectra than experimental results. Nevertheless, generally good agreement with the experimental measurements can always be obtained when a smaller peak intensity is used in the numerical simulations except that for Ar the QRS model fails to reproduce the enhanced distributions between 20 eV and 40 eV observed in the experiment. It should be noted that the experimental measurements for He at 3.0× 10¹⁴ W/cm2 in Ref. [28] are not shown here since the spectra above 4Up are not available.
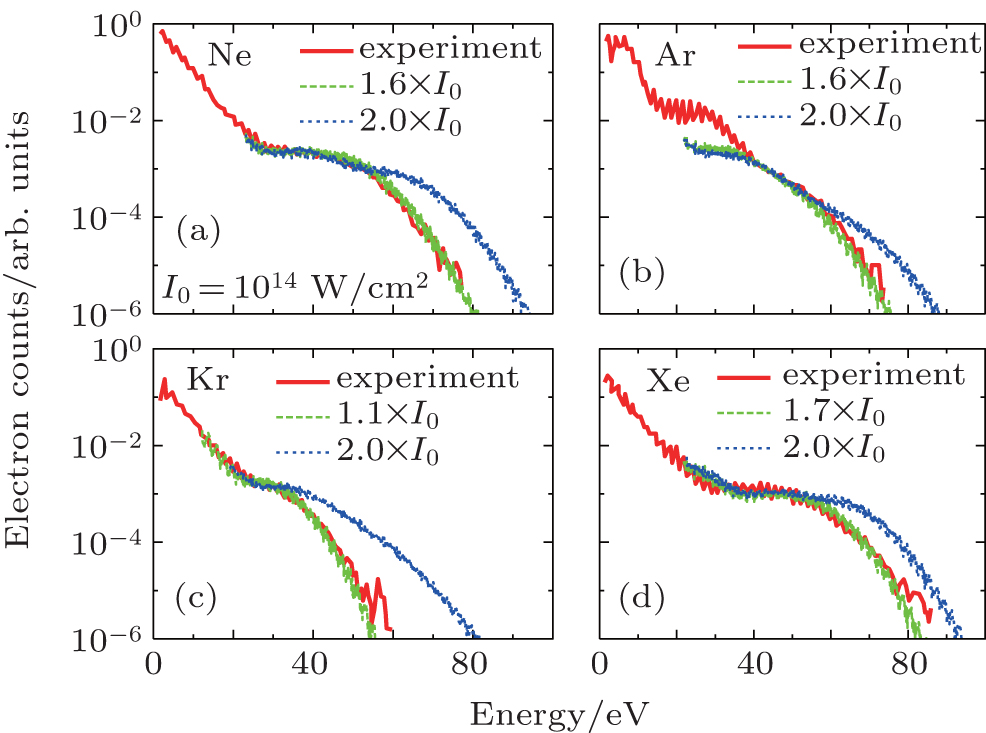 | Fig. 8. Comparison of the angle-integrated photoelectron energy spectra of the QRS model including the focal volume averaging and the experimental measurements of Paulus et al.[28] for single ionizations of (a) Ne, (b) Ar, (c) Kr, and (d) Xe in a 40-fs pulse with a wavelength of 630 nm. The peak intensity claimed in experiment for all atoms is 2.0× 10¹⁴ W/cm2 while for QRS the simulated results at two different peak intensities for each atom are plotted. The QRS results are shown for energies above 3Up– 4Up. The QRS spectra are relative and normalized to the experimental data at high energies. See text. |
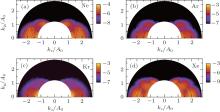
It can be seen clearly from Fig. 8 that the slope of plateau exhibits substantial differences between the various rare gases. Since the wave packets are target-independent, [6] the difference in the slope of plateau can only be attributed to the DCSs for different target ions. These DCSs are shown in Fig. 9. It should be noted that compared with the DCSs for He+ in Fig. 6, the DCSs for all the ions from Ne+ to Xe+ have much more structures. This structure feature is solely attributed to the short range potential and very useful for one to identify the target. To understand better how the DCSs affect the slope of the plateau, we also show the simulated 2D photoelectron momentum distributions in Fig. 10, from which the plateaus are obtained by integrating over the angle.
 | Fig. 9. Two-dimensional DCSs for elastic scattering of electrons with the full potentials of (a) Ne+ , (b) Ar+ , (c) Kr+ , and (d) Xe+ . |
Among the rare gas atoms from Ne to Xe, the DCSs for Xe+ have the most abundant structures. The DCSs for Ar+ and Kr+ are similar, each of which has a very sharp distribution at the smallest momentum and the largest scattering angle and drops very quickly as the momentum increases. As a result, the 2D momentum distributions for Ar and Kr in Figs. 10(b) and 10(c) decrease dramatically as the momentum and the outgoing angle of photoelectron increase. (Since the 2D momentum distributions are symmetric about kz = 0 for long pulses, one only needs to consider the part for kz > 0.) Consequently, the HATI photoelectron energy spectra for Ar and Kr in Figs. 8(b) and 8(c) each exhibit a deep slope. The plateau of Ne in Fig. 8(a) is nearly flat for a certain range of photoelectron energy due to the fact that the elastic scattering of electron with Ne+ has very large backward scattering DCSs at large scattering angles close to 180° for all the momenta in the range considered here. In addition, the DCSs almost remain the same value as the momentum changes for large scattering angles. This is why the 2D momentum distributions for Ne in Fig. 10(a) are strong at large momenta and small outgoing angles (corresponding to large scattering angles) which make substantial contributions to the yields at large photoelectron energies. Finally, the plateau of Xe in Fig. 8(d) even exhibits a slight increase for the range of photoelectron energies between 35 eV and 55 eV. This is because of the peak in the DCSs for Xe+ in the middle of momentum at large scattering angles close to 180° .
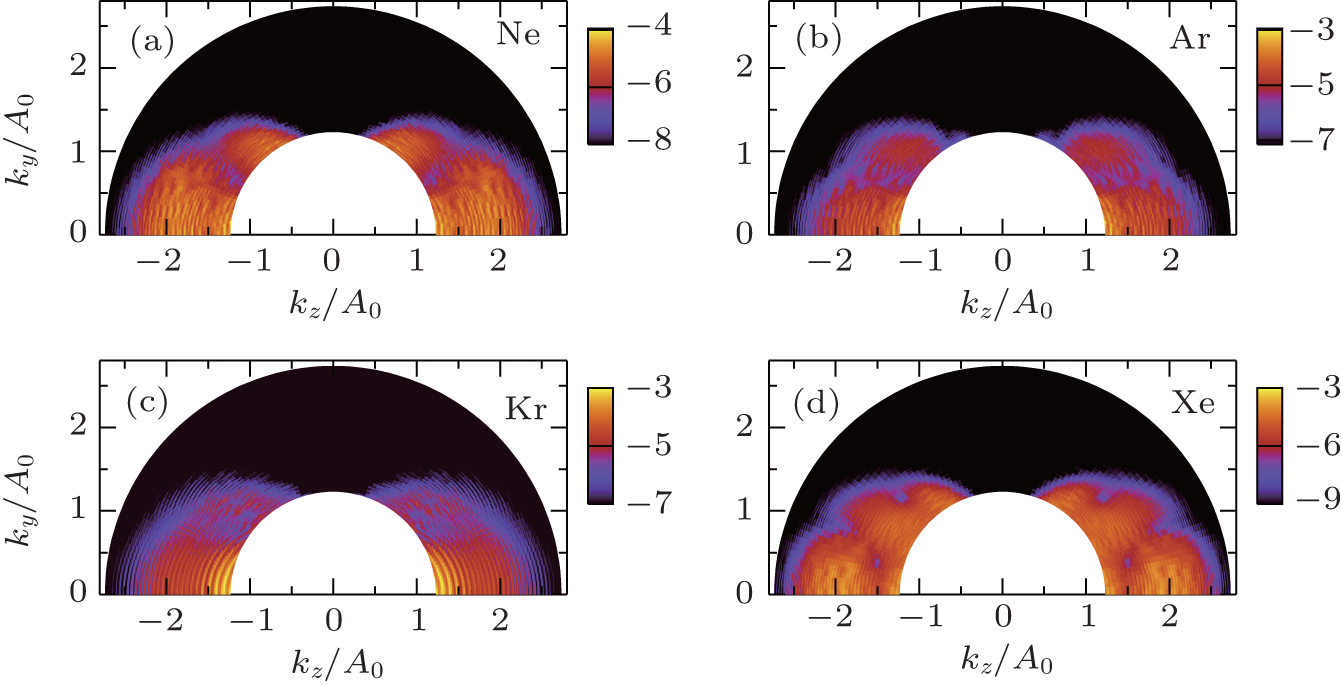 | Fig. 10. Logarithmic 2D photoelectron momentum distributions of the QRS model including the focal volume averaging for single ionization of rare gas atoms in a 40-fs pulse with a wavelength of 630 nm at the peak intensities of (a) 1.6× 10¹⁴ W/cm2 for Ne, (b) 1.6× 10¹⁴ W/cm2 for Ar, (c) 1.1× 10¹⁴ W/cm2 for Kr, and (d) 1.7× 10¹⁴ W/cm2 for Xe. The QRS results are shown for energies above 3Up. |
It should be mentioned that the explanation of the experimentally measured enhancement in the HATI spectra around 4Up for Ar in Fig. 8(b) is beyond the reach of the QRS model. Nevertheless, the subject about the enhanced spectra in HATI for rare gas atoms has attracted a lot of investigations both experimentally[29] and theoretically[30] although no consensus has been reached so far.
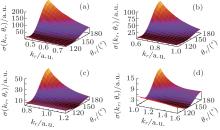
We now turn to the intensity dependence of the HATI plateau. In Fig. 11 we plot the experimental measurements of Paulus et al.[28] for single ionization of Ar in a 40-fs pulse with a wavelength of 630 nm at different peak intensities compared with the QRS simulations. Again, except for the resonance-like enhancement observed at the beginning of the HATI plateau, agreement between the experimental data and the theoretical simulations is generally fairly good if the estimated peak intensities in the experiment are adjusted. One can see from Fig. 11 that the plateau becomes flatter with increasing intensity. The same as before, the change of slope of the HATI plateau can be explained by the change of the DCSs shown in Fig. 12. At first glance, the structures of the DCSs in Figs. 12(a)– 12(c) corresponding to the peak intensities of 0.6× 10¹⁴ W/cm2, 1.1× 10¹⁴ W/cm2, and 1.7× 10¹⁴ W/cm2 respectively are almost the same. However, with a more careful look, one can find that the DCSs decrease more slowly as the momentum of the scattering electron increases from Fig. 12(a) to Fig. 12(c). Despite the change of structure, among all the cases in Fig. 12, the DCSs in Fig. 12(d) exhibit the smallest decrease in the momentum range from 1.0 to 1.6, and further more, the scattering electron experiences relatively the largest DCSs at large scattering angles close to 180° . This is the reason why the plateau at the highest peak intensity considered here is flattest.
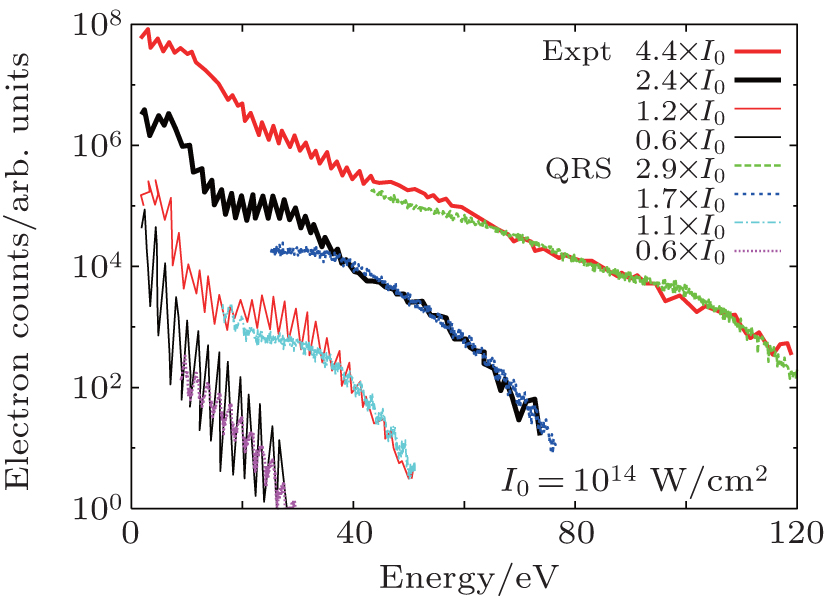 | Fig. 11. Comparison of the angle-integrated photoelectron energy spectra of the QRS model including the focal volume averaging and the experimental measurements of Paulus et al.[28] for single ionization of Ar in a 40-fs pulse with a wavelength of 630 nm. The long curves represent the experimental data and the short ones starting from 4Up denote the QRS simulations. The curves are separated in the vertical direction for visual convenience. From top to bottom, the laser peak intensities estimated in Ref. [28] for experimental measurements are 4.4× 10¹⁴ W/cm2, 2.4× 10¹⁴ W/cm2, 1.2× 10¹⁴ W/cm2, and 0.6× 10¹⁴ W/cm2, while the corresponding peak intensities used in the simulations are 2.9× 10¹⁴ W/cm2, 1.7× 10¹⁴ W/cm2, 1.1× 10¹⁴ W/cm2, and 0.6× 10¹⁴ W/cm2, respectively. The QRS results are normalized to the experimental data individually at high energies to obtain the best fit. |
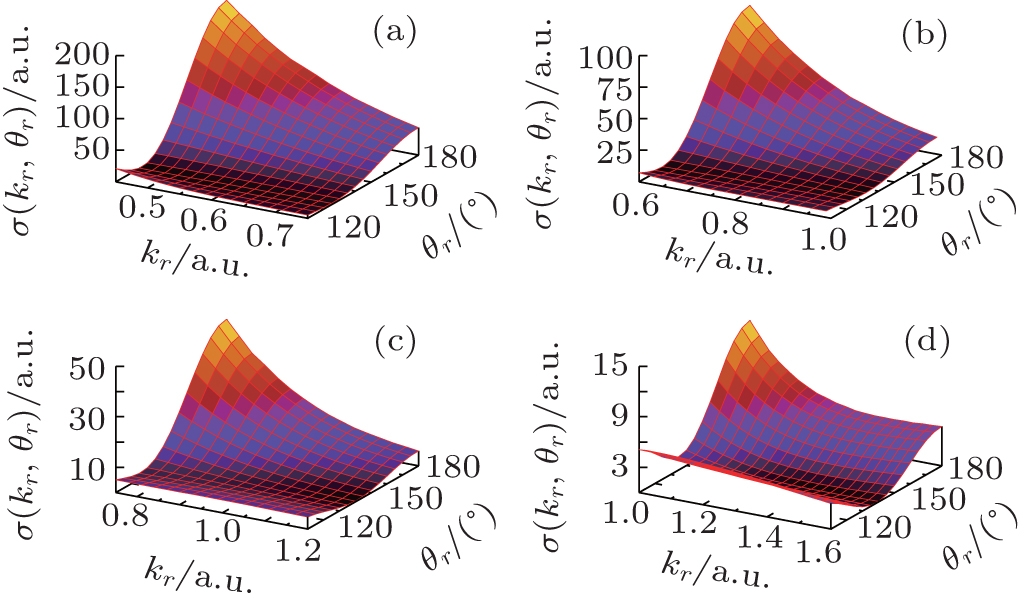 | Fig. 12. 2D DCSs for elastic scattering of electrons with the full potential of Ar+ at large scattering angles of 110° – 180° . The incident electron momenta are (a) 0.45– 0.75, (b) 0.60– 1.00, (c) 0.75– 1.20, and (d) 1.00– 1.60, corresponding to the high-energy plateau regions for the peak intensities of 0.6× 10¹⁴ W/cm2, 1.1× 10¹⁴ W/cm2, 1.7× 10¹⁴ W/cm2, and 2.9× 10¹⁴ W/cm2, respectively. |
In this work, we perform the QRS simulations for the HATI spectra and analyze the target and intensity dependence of the HATI plateau. The key merit of the QRS model is that the returning of electrons to the parent ion in the ionization process and the subsequent rescattering of the returning electrons with the parent ion are treated separately. The momentum distributions of the returning electron are described by the wave packets which have been found to be independent of the laser parameters while the rescattering can be regarded as totally laser-free. The returning electron wave packets can be obtained by the SFA. The accuracy of the QRS results highly depends on the method used to calculate the rescattering differential cross sections.
It is found that the elastic scattering of the laser-induced returning electron with its parent ion plays a significant role in the HATI process, and the difference in HATI plateau is mainly due to the elastic scattering DCSs. The simulated results with full potential of the target ion and the pure Coulomb potential only clearly reveal that the short range potential should always be included, especially for the rare gas atoms other than He.
The philosophy of the QRS model allows one to apply it to all laser-induced rescattering processes, such as high-order harmonic generation and nonsequential double ionization. Furthermore, it has already been demonstrated that the QRS model can be employed to extract atomic and molecular structures. However, the fact that the present QRS model does not include the effect of the resonance-like enhancements in HATI spectra indicates that the QRS model still has room for improvement.
| 1 |
|
| 2 |
|
| 3 |
|
| 4 |
|
| 5 |
|
| 6 |
|
| 7 |
|
| 8 |
|
| 9 |
|
| 10 |
|
| 11 |
|
| 12 |
|
| 13 |
|
| 14 |
|
| 15 |
|
| 16 |
|
| 17 |
|
| 18 |
|
| 19 |
|
| 20 |
|
| 21 |
|
| 22 |
|
| 23 |
|
| 24 |
|
| 25 |
|
| 26 |
|
| 27 |
|
| 28 |
|
| 29 |
|
| 30 |
|